

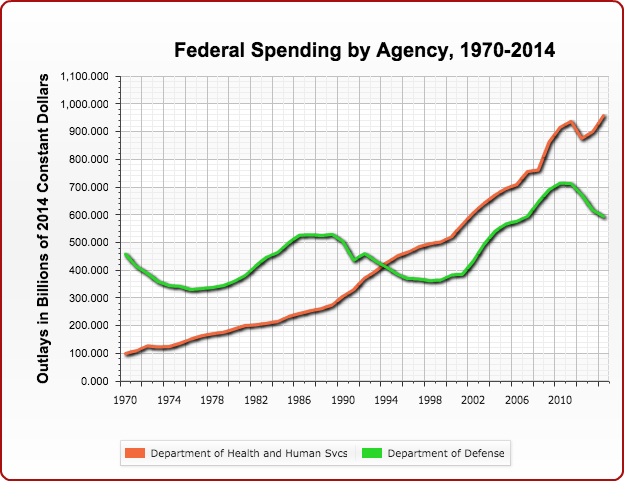
Chris Edwards of the Cato Institute has launched a great new tool for understanding federal spending trends since 1970. It’s the “Make Your Own Spending Chart” interactive on downsizinggovernment.org.
You just check whichever federal department you want to graph and it appears on the chart just to the right. Then just right-click on the chart if you want to save it.
Recommended Stories
One to think about saving would be spending by the Department of Health and Human Services and the Department of Defense, as is done in the accompanying chart.

So much for the hoary old myth that defense spending is the largest chunk of the federal budget. Why Chris McDaniel lost I
Washington Examiner columnist Star Parker is getting grief from some readers who mistakenly think she is endorsing Sen. Thad Cochran‘s disreputable tactics in defeating state Sen. Chris McDaniel in last week’s Mississippi Republican Senate primary runoff.
Parker’s point is not that Cochran’s tactics were acceptable, but that McDaniel made a huge mistake in not taking his Tea Party conservative message specifically and actively to Mississippi’s black voters.
“But the McDaniel campaign seemed clueless that there were potential allies in Mississippi’s huge black population to counter Cochran’s liberal assault,” Parker wrote.
“It is pathetic that some commentators are actually writing that Cochran’s government plantation appeal to blacks shows how Republicans can reach this community,” she said.
Why Chris McDaniel Lost II
Over at Forbes, contributor Louis Woodhill also condemns Cochran’s tactics as “egregious and disgusting,” but he points to what he considers another McDaniel mistake.
“The ‘Issues’ section of McDaniel’s campaign web site contained 1,646 words. Although rapid economic growth is both America’s most pressing need and Washington’s most conspicuous failure, the term ‘economic growth’ did not appear in McDaniel’s ‘Issues’ text,” Woodhill points out.
Woodhill’s conclusion is by no means beyond argument, but it’s certainly worth pondering by Tea Party candidates, strategists and donors:
Tea Party isn’t going away
No matter why the Mississippi GOP Senate primary runoff became a Cochran upset, Wes Pruden, editor emeritus of the Washington Times (and my much-esteemed former boss there), looks beyond the finger pointing and second-guessing to conclude:
